
When I have a bit of down time from client work, I like to experiment with methods and techniques that I don’t expect to come up in client work very often. Generative Adversarial Networks are such a technique. GANs have been a very active area of research since they were […]
Blog Posts
68 posts

It’s tricky but the short answer is yes, sorta. There are certain limitations, of course, but with some creative problem solving, you can do quite a bit with this ETL tool.
If you have been following tech news for the last few years you have probably noticed a lot of talk about Machine Learning and how it is changing various industries. Analytics has especially had a lot of talk about it with basically every company in the industry releasing their own […]
Nucleus Research, an independent IT market research company specializing in investigative research and ROI analysis of technology deployments, recently released the results of a study that looked at how users used corporate performance management (CPM) tools, what kinds of functionality they found most useful and also at the strengths and […]
It’s the most wonderful time of the year — that is, if you’re a college basketball fan. It’s March Madness! For the next several weeks, all you’ll be hearing about in your office is smack talk about whose alma mater is superior, whose brackets are busted and who must […]

“My bounty is as boundless as the sea, My love as deep; the more I give to thee the more I have, for both are infinite.” -William Shakespeare, Romeo & Juliet When Juliet spoke of her love for Romeo as infinite, she was speaking metaphorically. After all, love is […]

If you’re like me or anybody else who travels frequently (or perhaps just lives in a particularly large city), you’ve probably become familiar with yelp, foursquare, or any of a number of different sites and apps designed to help you find somewhere to eat or other goods and services in […]

Writing about Donald Trump—especially nowadays—is likely to incite a heated discussion and lose you friends. Whether or not you’re for or against him and his politics, it’s interesting that so few of the political bigwigs managed to foresee that he would get this far. Specifically, Nate Silver and his statistical […]

A successful business envisions a continuous progress through a strong sense of planning and implementation. The planning phase is a crucial part of performance management wherein the business path is determined by using variables that affect performance. While it’s true that there is no straightforward path to success, there are […]

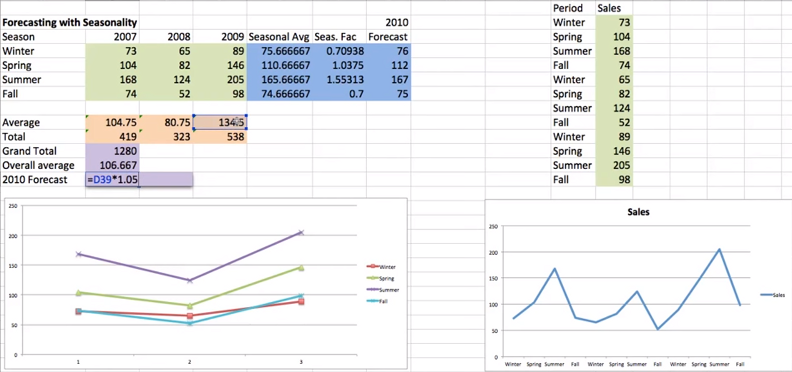
If you have years worth of sales data, you can use that data, with the help of Excel, to predict upcoming trends and help you plan for your business. Forecasts can help you with important business decisions, such as managing staff and inventory, planning budgets, and predicting cash flow issues. […]